Western Australia Lithium Mine: 1.5-Month Trial Comparison
Trial Overview
This 1.5-month trial compared a one-week baseline period in September to a follow-up week in November. The study demonstrated a direct correlation between improved road surfaces and operational efficiency, with data-driven maintenance decisions yielding measurable gains across key performance indicators.
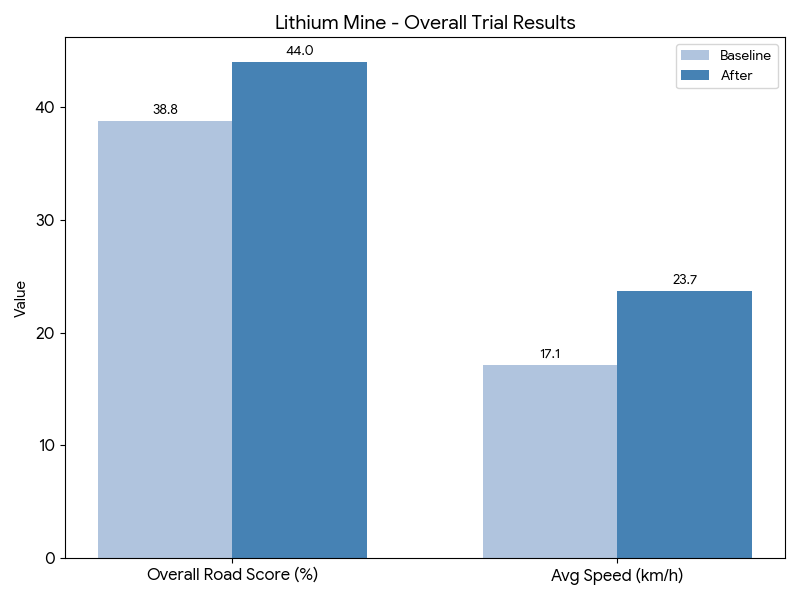
Average Truck Speed
+6.6 km/h
17.1 → 23.7 km/h
Overall Road Score
+5.2%
38.80% → 44%
Top Section (C1-ROM)
+22.8%
62.5% → 85.3%
Overall Trial Results
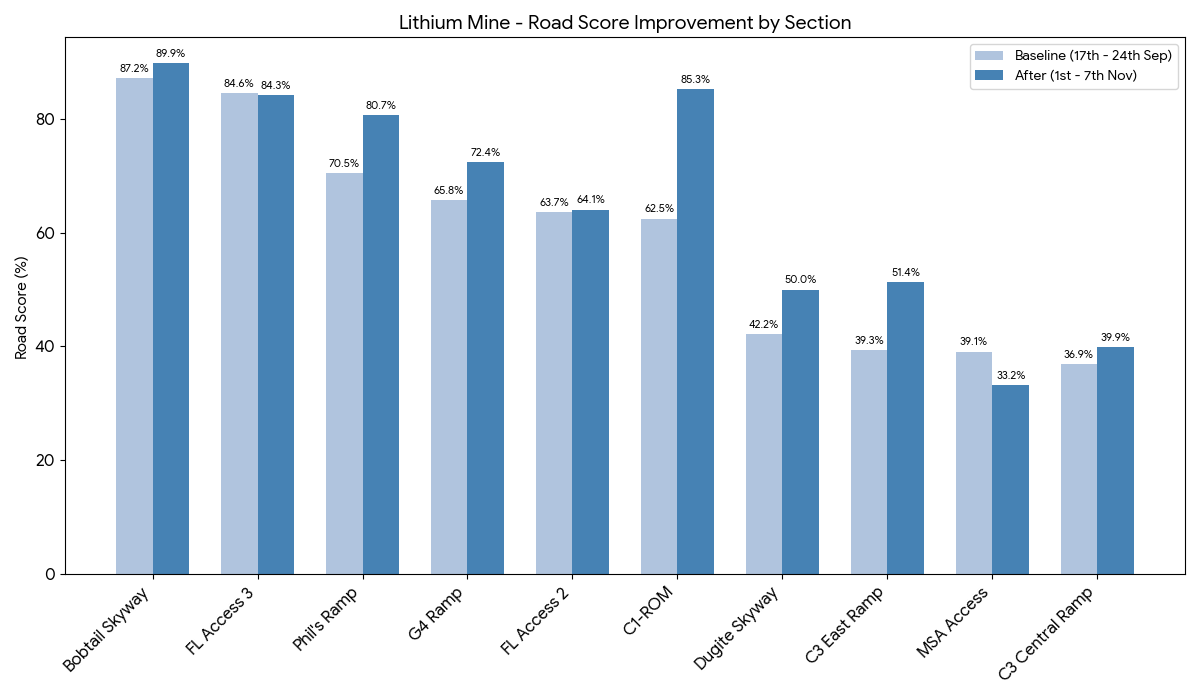
Sectional Performance & Progress
| Section | Change | Category |
|---|---|---|
| C1-ROM | +22.80%(62.5% → 85.3%) | Top Performer |
| Phil's Ramp | +10.20% | High-Growth Area |
| C3 East Ramp | +12.10% | High-Growth Area |
| Bobtail Skyway | 87.2% → 89.9% | Steady High-Quality Zone |
| FL Access 3 | -0.30% | Continuous Improvement Area |
| MSA Access | -5.90% | Continuous Improvement Area |
FL Access 3 and MSA Access saw slight decreases, providing actionable data for future maintenance adjustments and prioritisation.
Operational Impact Summary
Integrating real-time road data into the daily maintenance regime is the primary driver of these results. The 6.6 km/h speed increase directly reduces cycle times, allowing the fleet to move more material without adding more vehicles to the site—delivering measurable ROI through data-driven decision-making.